
Thursday, January 19, 2017
FAERS Popcorn
Gotta love some of the things you find in FAERS, including the deadly popcorn as a secondary suspect for confusion sedation, and vasodilation.

Friday, January 13, 2017
FDA MAUDE, Patient Outcomes and "8."
The FDA's MAUDE database contains reports on malfunction of medical devices. You can run more comprehensive searches here.
There's a lot of information buried in the MAUDE database, including the outcomes of patients who were on the receiving end of a malfunctioning device.
Specifically, the MAUDE database uses a 1-letter code to list the following possible outcomes:
Here's some additional weirdness.
The graph shown above only goes back to late 2012.
You can go all the way back to 1991 and plot MAUDE outcome data.
What you see are periodic spikes of "8." (see blue line in chart below).
Again, I have no idea why "8." would take up 30+% of the patient outcomes in September of 2004, but it's there.
There's a lot of information buried in the MAUDE database, including the outcomes of patients who were on the receiving end of a malfunctioning device.
Specifically, the MAUDE database uses a 1-letter code to list the following possible outcomes:
- Congenital Anomaly (C)
- Death (D)
- Disability (S)
- Hospitalization (H)
- Life Threatening (L)
- Other (O)
- Required Intervention (R)
- plus a few others that are not particularly interesting.
Lately, the FDA has stopped listing patient outcomes and have replaced them with the following cryptic message: 8. That's right, the digit 8 and a period. I have no idea what that means, but there has been no patient outcome information (other than "8.") in the MAUDE database for ALL of 2016.
Let's take a look at the rise of "8." (see blue line below). If we go back to 2012 and 2013, we can see that only 1 - 5% of MAUDE reports had an outcome of "8."
Things start to change in the spring of 2015, when "8." begins an exponential march upward.
By October 2015, 100% of the MAUDE reports show an outcome of "8." and it hasn't relinquished its stranglehold since.
I have no idea what "8." means.
If anyone knows what "8." means, please let me know!!!
Things start to change in the spring of 2015, when "8." begins an exponential march upward.
By October 2015, 100% of the MAUDE reports show an outcome of "8." and it hasn't relinquished its stranglehold since.
I have no idea what "8." means.
- Is it a database error?
- Does it mean that the FDA has stopped releasing this information?
- Something else entirely?
If anyone knows what "8." means, please let me know!!!
Here's some additional weirdness.
The graph shown above only goes back to late 2012.
You can go all the way back to 1991 and plot MAUDE outcome data.
What you see are periodic spikes of "8." (see blue line in chart below).
Again, I have no idea why "8." would take up 30+% of the patient outcomes in September of 2004, but it's there.
And then there's MAUDE
FDAble also provides clients with adverse event and malfunction information for medical devices using the FDA's MAUDE database. MAUDE is an acronym for Manufacturer and User Facility Device Experience Database. I think we can all agree that this is a horrible name, unless you are a fan of Bea Arthur
 .
.
The MAUDE database is weird in so many ways (more about that in a future post), but one of its remarkably nice features is that it provides a free-form narrative describing the problem associated with each report. In contrast to MAUDE, the FDA does not provide the narratives for FAERS data (unless you file a FOIA request and are willing to wait about 1 month).
From the looks of it, the FDA currently receives about 80-90 thousand MAUDE reports per month (which is roughly the same magnitude as the number of FAERS reports received per month as well). You can also see that MAUDE recently celebrated its 300th month anniversary (starting in December of 1991).
The FDA started including manufacturer reports in August of 1996, which explains the giant leap in the # of reports at that time.
Wednesday, January 11, 2017
FAERS Reports on Counterfeit Medications
AARP magazine is using some FAERS data that I provided as part of a forthcoming article on adverse events and counterfeit medications.
They were interested in FAERS reports in which counterfeit was part of the MedDRA preferred term. This included:
A common co-reported adverse reaction was drug ineffective (not surprising).
The patient outcomes in this group of cases is disturbing, with 703 cases reporting death.
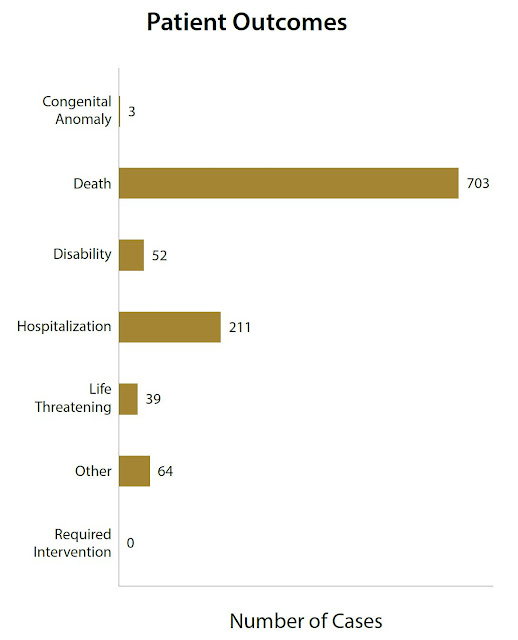

They were interested in FAERS reports in which counterfeit was part of the MedDRA preferred term. This included:
- suspected counterfeit product
- product counterfeit
- counterfeit drug administered
A common co-reported adverse reaction was drug ineffective (not surprising).
The patient outcomes in this group of cases is disturbing, with 703 cases reporting death.

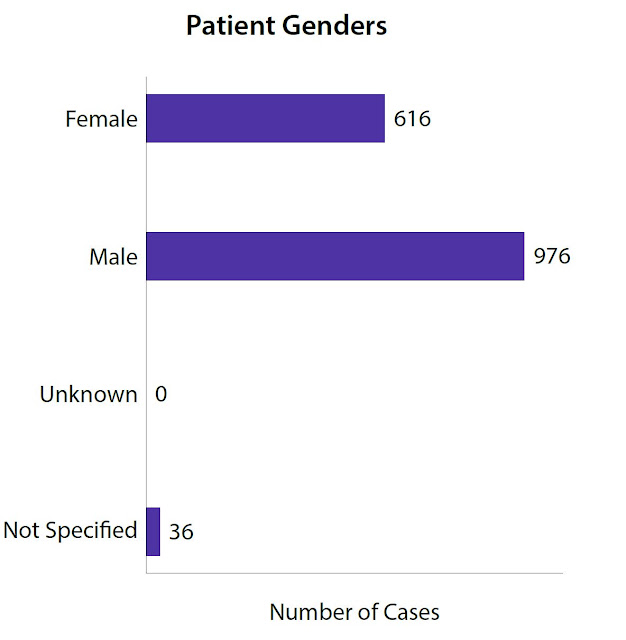
In contrast to the overall FAERS database, the reports concerning counterfeit drugs are dominated by males.

There is also a spike in the # of reports of counterfeit products in 2015. Keep in mind that the FDA has not yet released data for the 4th quarter of 2016, but it seems unlikely that one additional quarter's worth of data will push 2016 above the 2015 number.

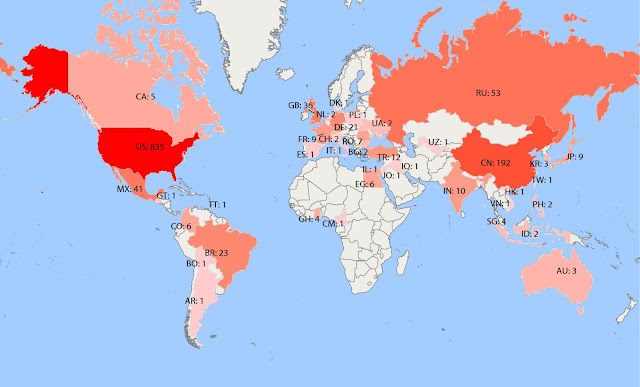
Here's the distribution of "occurring countries." More than I expected in China since this database is focused on the USA.

Tuesday, January 10, 2017
Age / Gender Distribution in FAERS Reports
If you break FAERS reports by gender / sex, you'll see that the number of reports for females is remarkably larger than the number of reports for males. My speculation is that this has to do with the notion that men feel that filing a report complaining about their meds makes people question their masculinity. Again, no idea if that's true, but it seems reasonable.
More importantly, my son's moonshot has gotten better.

Below, you can see histograms of FAERS reports partitioned by patient age and gender.
Some highlights:
Some highlights:
- The female age distribution is in pink.
- The median female age is 55 years.
- The male age distribution is in blue (most of the male distribution shows up as purple because it is overlaid on the pink female distribution (pink + blue = purple).
- The median male age is 58 years.
- You can see the # of female reports dominates over the male reports.
- There is one exception and that is with young patients (reports for males are more common for newborns up to about 13 yo).
- Then the shape of the female and male distributions is roughly identical except for the "hump" from ages 17 to 45 in the female distribution, which means that females report more frequently in all age groups from 17 years and up, but they report much more frequently from 17 to 45ish.
More importantly, my son's moonshot has gotten better.

Sunday, January 8, 2017
Improved FAERS Reports
I spent some free time in the past month or so improving the summary documents that go with the FAERS reports that we sell (click here to download a sample report).
The pics below are for FAERS cases in which OxyContin is a primary suspect.
Here is a chart of new OxyContin cases per year. Clients ask for this a lot, and I've finally automated the process of generating this type of chart.

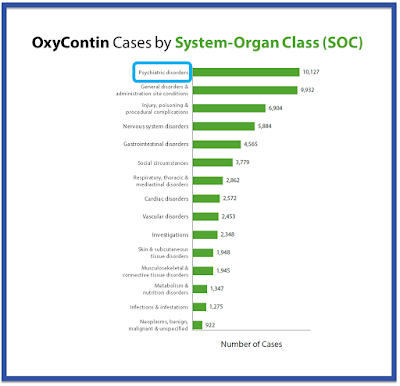


The pics below are for FAERS cases in which OxyContin is a primary suspect.
Here is a chart of new OxyContin cases per year. Clients ask for this a lot, and I've finally automated the process of generating this type of chart.

This bar-graph shows OxyContin adverse events grouped by MedDRA System-Organ Class (SOC). This is also something that many clients have asked for in the past. I also have automated grouping of adverse events by high-level group term (HLGT), and high-level terms (HLT), which I think may be helpful for regulatory filings.

I'm not sure how useful this heat-map is, but it looks nice. The title is self-explanatory.

Finally, here is an awful photo of the moon that I am proud of since my 10-year old son took it in the freezing cold about 1 week ago. He got a telescope for Christmas and he held my phone up to the eyepiece with his shaky hands. I think you can actually see a crater or two in the photo. The actual view through the eyepiece with our human eyes was far more impressive.

Friday, January 6, 2017
# of FAERS Cases w/ non-serious outcomes has risen?
Okay. I think this is slightly more interesting than the previous post.
Every AERS/FAERS cases has the possibility of listing a serious outcome from an adverse event.
These outcomes fall into the following (non-mutually exclusive) categories:
After late 2010, the # of serious outcomes begins to lag the # of reports, which indicates one of three things:
Data and code are here: https://github.com/pdanese/faers_counts_Q3_2016
Below is a slightly different way to view the same information.
The plot shows the ratio of serious patient outcomes to the number of reports filed per quarter. You can see that in the "early 2000s" the number of serious outcomes per report was around 1, but it has dropped in recent years 0.6 to 0.8 range. So, about 20 -- 40% of the FAERS reports since late 2012 do not report a serious outcome.
Here's some background on the FDA Adverse Event Reporting System (FAERS)
These outcomes fall into the following (non-mutually exclusive) categories:
- congenital anomaly
- death
- disability
- hospitalization
- life-threatening
- required intervention to prevent permanent impairment
- other (serious outcome)
After late 2010, the # of serious outcomes begins to lag the # of reports, which indicates one of three things:
- The increase in the # of FAERS reports submitted over the past six years is mostly due to an increase in submission of reports w/ non-serious outcomes.
- The increase in the # of FAERS reports submitted over the past six year is mostly due to an increase in submission of reports w/ unknown outcomes.
- Some combination of points 1 and 2.
Data and code are here: https://github.com/pdanese/faers_counts_Q3_2016
Below is a slightly different way to view the same information.
The plot shows the ratio of serious patient outcomes to the number of reports filed per quarter. You can see that in the "early 2000s" the number of serious outcomes per report was around 1, but it has dropped in recent years 0.6 to 0.8 range. So, about 20 -- 40% of the FAERS reports since late 2012 do not report a serious outcome.
Thursday, January 5, 2017
FAERS Report Sources Almost Non-Existent These Days
Yesterday's post is admittedly boring. I mean, AERS / FAERS reports have been going up over time (for the most part) with occasional "pauses" but is there anything more interesting in this gross analysis of the FAERS database?
Mayyyyyybe.
First, another boring bit.
Each FAERS report received by the FDA usually lists multiple medications (not a big surprise--many people take multiple medications). Each medication listed in a FAERS report gets its own record. So, we can ask:
Has the # of reported medications per report changed over time?
Short answer: probably not.
Below is a chart of the # of drug entries per quarter (blue line).
You can see that it roughly correlates with the # of reports per quarterly release (red line).
You can be a little more rigorous and plot the mean number of drug entries per report (per quarter) [see chart below]. I don't want to do the statistics on this, but my suspicion is that the regression line would be relatively flat, which means the # of reported meds per report hasn't changed much over time.
It looks as though there are about 3.5 medications listed per FAERS report and that's held steady.
I guess that's good. Maybe that means that there hasn't been a shift in adverse events related to the sheer number of drugs taken (per patient) over the past 20 or so years. I know that's a really speculative conclusion, but I suspect there's a kernel of truth in there.
But there's more information included in FAERS reports!
For example, each report can indicate the source of the adverse information. This is formally known as the Report Source. Some possible report sources include:
You can download data and code here: https://github.com/pdanese/faers_counts_Q3_2016
Mayyyyyybe.
First, another boring bit.
Each FAERS report received by the FDA usually lists multiple medications (not a big surprise--many people take multiple medications). Each medication listed in a FAERS report gets its own record. So, we can ask:
Has the # of reported medications per report changed over time?
Short answer: probably not.
Below is a chart of the # of drug entries per quarter (blue line).
You can see that it roughly correlates with the # of reports per quarterly release (red line).
You can be a little more rigorous and plot the mean number of drug entries per report (per quarter) [see chart below]. I don't want to do the statistics on this, but my suspicion is that the regression line would be relatively flat, which means the # of reported meds per report hasn't changed much over time.
It looks as though there are about 3.5 medications listed per FAERS report and that's held steady.
I guess that's good. Maybe that means that there hasn't been a shift in adverse events related to the sheer number of drugs taken (per patient) over the past 20 or so years. I know that's a really speculative conclusion, but I suspect there's a kernel of truth in there.
But there's more information included in FAERS reports!
For example, each report can indicate the source of the adverse information. This is formally known as the Report Source. Some possible report sources include:
- Health Professionals (physicians, etc.)
- Company Representatives (the pharmacovigilance department let's the FDA know)
- Scientific Literature (information is published in a medical journal)
- Pharmaceutical Distributor
- etc. etc.
The chart below shows the number of sources listed per FAERS report over time and it indicates that the report source information is essentially dead. . These days, less than 1 FAERS report out of 40 contains report source information. This doesn't seem like absolutely critical information for the FDA to publish, but I'm still surprised that it's fallen by the way-side.
You can download data and code here: https://github.com/pdanese/faers_counts_Q3_2016
Wednesday, January 4, 2017
New FAERS Data Q3-2016
FDA recently released FAERS data for 3rd quarter of 2016. Seems as though we've hit a flat period where the # of reports per quarter is moderately stable in the low 300,000-range. Maybe it's just a pause.
Putting the Band Back Together

Subscribe to:
Posts (Atom)